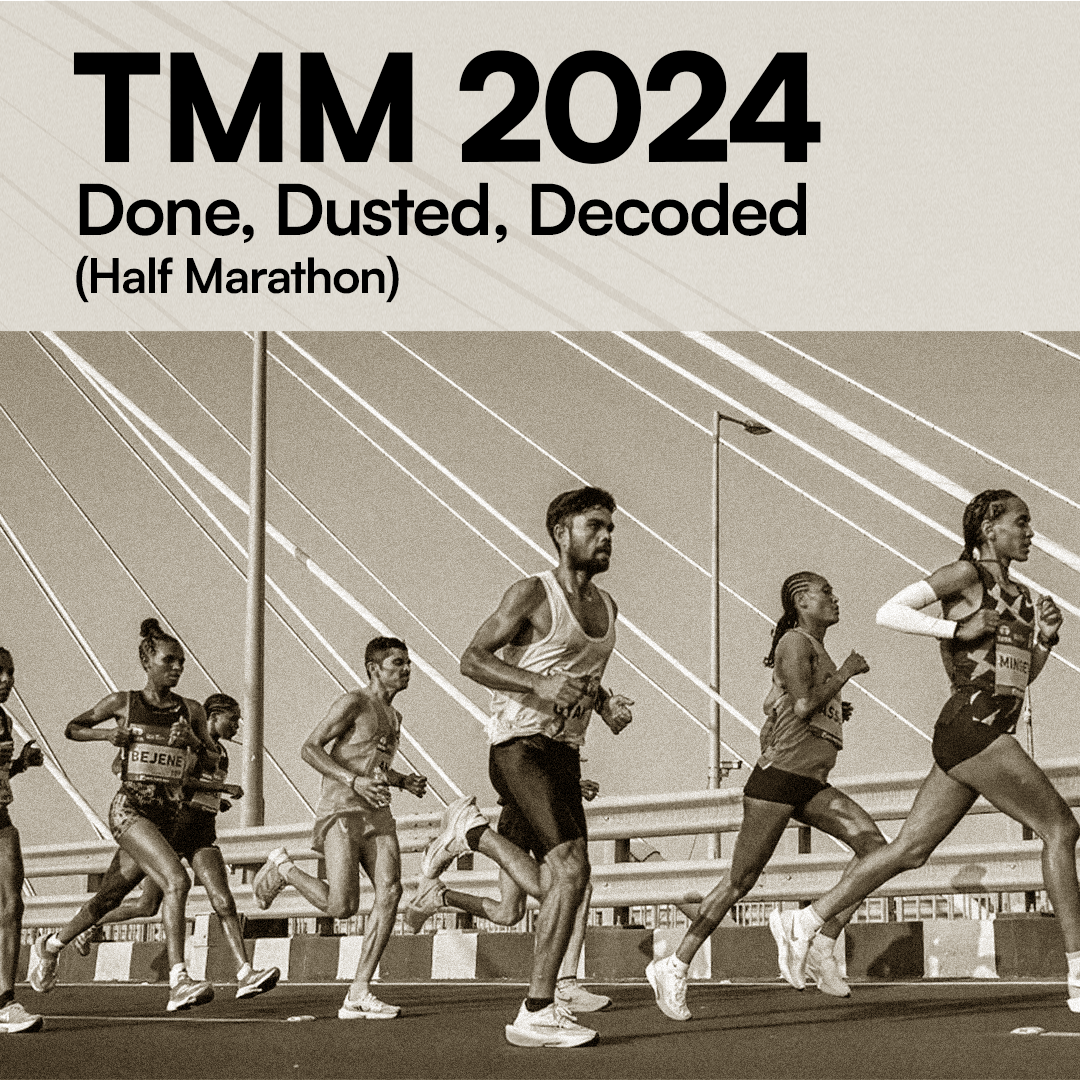
TMM 2024: Done, Dusted, Decoded (Half Marathon)

The running season is coming to an end and that gives an opportunity for us to look at data from past races and training and make changes in the off-season to better our performance. This allows us to come back stronger as the racing restarts in a couple of months. We took a deeper dive into the half marathon finishers and tried to make sense of it all for you. And what better race to pick up other than the biggest one of Mumbai, the Tata Mumbai Marathon.
Please note that no two runners are the same. What may be present in this study may or may not be the best for you. Use the below information to make an informed decision about your training and implement changes as necessary.
To begin with:
– We have looked at half marathon finishers only and did not look at other distances.
– We used open sources such as Strava, Garmin and data from our own trainees who have finished the race.
– We looked up historic running data of some of the runners beyond TMM to draw any correlations.
– We looked up data of finishers between 1hr 20 minutes and 3 hrs 10 minutes.
Here are key findings of the race:

From the average heart rate, you will see that the finishers below 2 hrs and 40 minutes are still averaging above 175 beats per minute. From any and all calculations of MHR (maximum heart rate) percentage, runners are pushing too hard without training sufficiently. Since most of the finishers were over 35, the range of 175-184 avg heart rate reflects less training and more fatigue. We strongly recommend runners to train appropriately and not fatigue their body excessively in the race. Without proper training, the race experience could be painful and have long term negative health implications on the body.

The data shows that a number of runners hit their max heart rate in the race too early. When paced appropriately, the MHR of the race should appear late in the race generally in the final few kilometres. The trained runners hit their race MHR around km 15 (the Pedder road incline) and in kilometre 20 and 21. However, the slower runners started too fast and faded out as the race progressed.

While most of the runners dread the Pedder Road stretch, it is not difficult to climb with good training. You will see from the data that faster runners did not slow down a lot from their average paces while ascending the incline. The slower runners slowed down a lot while climbing, which once more points towards the need for right training and education.

The faster runners either ran an equal split or they ran a negative split (second half of the race being faster than the first half). The slower runners, and possibly less trained runners, ran the first half of the race a lot faster and were most likely exhausted as the race progressed. This further showcases the need for runners to train and pace appropriately.

Uniform paces! The ability to hold a certain speed or pace for long durations is key. Keeping the change to a minimum is a trait found among faster runners and this data and observation proves just that. Consistency is key.

Most of the faster runners were close to the optimal cadence value of 180. However, the slower runners went as low as 119 steps per minute. The data shows that the cadence went down as the finish time increased. Moving optimally includes higher cadence turnover. This also means that one needs to work on their biomechanics and core strength as much as they work on their running. To run well, you must make informed decisions to improve and race better.
In closing:
This study is a reflection of almost everything the entire running community regularly talks about. We hope that you will make good use of your time and focus on improving the basics of your running so that you are ready for long term, sustainable training and performance in the years to come.
Happy Running!


